
- What is Manufacturing Analytics?
- What Are the Benefits of Manufacturing Analytics?
- How Does Manufacturing Analytics Work?
- How Does Manufacturing Analytics Work in Practice?
- The Role of Machine Learning in Manufacturing Analytics
- Other Case Uses
- Best Practices for Implementing Manufacturing Analytics
- Get in Touch with Codence
- Read more
Manufacturing Analytics applies data science and engineering to industrial processes. It boosts efficiency, quality, and data-driven decisions by integrating Industry 4.0 technologies. It combines data from sources like ERP, MES, SCADA, IoT, and PLCs to generate insights. Learn more about it.
The ongoing digital revolution is transforming the industrialized world in profound ways, with the manufacturing sector being one of the most impacted. Powered by technology, this industry is constantly evolving to meet changing market demands.
The advent of advanced tools and technologies such as artificial intelligence, machine learning, IoT, and cloud computing are helping manufacturers optimize production, streamline operations, and make informed business decisions. This wave of transformation is not just a trend; it’s fundamentally shifting the way manufacturers think and operate.
In such a rapidly changing environment, the ability to adapt quickly, innovate, and implement operative strategies can make the difference between leading the manufacturing wave or being left far behind. Our new Machine Learning-powered dashboard has been designed with this reality in mind, aiming to support manufacturing businesses in this journey.
Let’s dive deeper into how manufacturing analytics is shaping smarter operations and how you can stay ahead. Keep reading to explore these insights!
What is Manufacturing Analytics?
Manufacturing analytics is the use of data and technology to improve how factories work. By using tools like manufacturing analytics software, manufacturers can analyze big data collected from machines, IoT devices, and processes to make smarter decisions.
It plays a key role in digital transformation by combining predictive analytics, artificial intelligence, and machine learning to solve problems before they happen, improve quality control, optimize production scheduling, and enhance manufacturing operations management.
With data-driven manufacturing, companies can better manage resources, boost efficiency, and protect systems with strong cybersecurity. Manufacturing analytics connects business intelligence with the power of Industry 4.0, making factories smarter and more efficient for the future.
What Are the Benefits of Manufacturing Analytics?
In manufacturing, relying on data-driven decision-making means using reliable facts and figures to guide strategies, rather than guessing or relying solely on experience. With the rise of digitization and access to operational data, this approach has become essential for optimizing manufacturing operations management. Here are the key benefits:
- Improved precision in operations: predict demand, adjust inventory, manage supply chains, and reduce downtime to boost productivity and efficiency.
- Operational efficiency: identify and fix inefficiencies by analyzing production, maintenance, and quality control data to avoid major disruptions.
- Enhanced market insights: understand market trends and consumer behavior through business intelligence, adapting operations and products to meet demands.
- Risk mitigation: analyze data to foresee market changes, operational challenges, or uncertainties, enabling proactive strategies.
Adopting data-driven manufacturing isn’t just about collecting data—it’s about using it effectively to stay competitive in today’s fast-paced, Industry 4.0 world.
Read More: Top 12 Strategies for a More Efficient Law Firm
How Does Manufacturing Analytics Work?
Manufacturing analytics works by collecting, analyzing, and interpreting data from every part of the manufacturing process. Using tools like manufacturing analytics software, it integrates data from IoT devices, machines, and systems to provide actionable insights. Here’s how it happens, step by step:
- Data collection: sensors, IoT devices, and other equipment gather big data from production lines, maintenance schedules, and quality checks.
- Data integration: the data is centralized in platforms, such as business intelligence tools, that combine information from multiple sources.
- Data analysis: technologies like machine learning and artificial intelligence analyze this data to uncover trends, predict problems, and suggest improvements.
- Actionable insights: analytics highlight areas for improvement, whether in production scheduling, quality control, or cybersecurity.
Decision implementation: manufacturers use these insights to optimize processes, reduce downtime, and enhance overall performance.
How Does Manufacturing Analytics Work in Practice?
Manufacturing analytics is the foundation of modern, data-driven industry, focused on optimizing resources and processes. The real question is: how do we actually collect and transform this strategic information into productivity gains and reduced failures?
We’ve broken down manufacturing analytics into 5 steps, from data collection and modeling processes all the way to the final analysis results and insight generation. Let’s check them out!
Step 1: Industrial Data Collection
Manufacturing analytics starts on the factory floor, where various devices and systems capture fundamental variables of the production process. This data indicates machine performance, allowing future problems and production bottlenecks to be anticipated.
Common Data Sources:
- IoT Sensors: Measure temperature, pressure, vibration, and electrical current. Example: identifying motor overheating;
- PLCs (Programmable Logic Controllers): Record machine status, production cycles, and alarms. Example: knowing if a machine is active or the number of parts produced;
- MES (Manufacturing Execution Systems): Control production orders and cycle times. Example: total time to complete an order;
- ERP (Enterprise Resource Planning – like SAP and Oracle): Provide inventory, sales order, and cost data. Example: quantity of raw material consumed;
- Maintenance Systems (CMMS): Report failures, downtime, and work order history. Example: motor stopped for 2 hours due to electrical failure.
Technologies Used:
- Industrial Protocols: OPC-UA, MQTT, Modbus – responsible for transmitting data between machines and systems;
- IoT Gateways: Equipment that connects sensors and devices to the cloud environment;
- Edge Computing: Enables local data pre-processing, reducing latency and bandwidth usage.
Step 2: Data Integration and Processing (ETL)
After being captured, data undergoes processing and standardization, making it ready for analytical use. This phase is known as ETL: Extract, Transform, Load.
Processing or cleaning data means working to standardize its formats, such as converting units of measurement, as well as eliminating and correcting inconsistencies and null values.
Following this, there’s also the data enrichment process, where data is integrated and cross-referenced with information from other sources. This allows for a more complete and precise combination of information for analyses.
Common Tools and Languages:
- Python: Used with libraries like pandas and pyodbc for industrial data manipulation;
- ETL Platforms: Tools such as Apache NiFi, Talend, and Azure Data Factory automate data workflows;
- Intermediate Databases: SQL Server, PostgreSQL, or InfluxDB are used as temporary hubs or for time-series analysis.
Step 3: Data Storage in Manufacturing Analytics
After processing, industrial data gets stored based on its nature: how often it’s collected, its structure, and its volume. Here are the most common storage types:
- Time-series databases (InfluxDB, TimescaleDB): These are perfect for frequent sensor readings, like temperature changes every second;
- Relational databases (PostgreSQL, SQL Server): These store structured information, such as production orders or machine registries;
- Data Lakes (S3, Azure Data Lake): Used for handling massive amounts of unstructured, raw, or uncleaned data;
- Industrial Historians (PI System, Ignition): These specialize in continuous data coming from SCADA and MES systems.
This structured storage is crucial for ensuring efficient and scalable Manufacturing Analytics.
Step 4: Industrial Data Analysis and Modeling Types
With the data organized, the industrial analytics phase begins. Here, statistical models and machine learning algorithms generate valuable insights.
Data analysis works with four main types of analysis, each with a different function:
- Descriptive Analysis: Understanding what’s happening now. Example: a drop in productivity on a specific line.
- Diagnostic Analysis: Discovering the cause of events. Example: why scrap increased during a shift.
- Predictive Analysis: Forecasting future events. Example: risk of a pump failure.
- Prescriptive Analysis: Recommending optimal actions. Example: automatic adjustment of process parameters.
In manufacturing analytics, these concepts are also applied, with software and tools assisting each modeling type. The most common are:
- Dashboards & BI: Power BI, Tableau, Grafana – for interactive visualization of industrial indicators.
- Statistical Languages: Python (Scikit-learn, statsmodels) and R for predictive and statistical modeling.
- Industrial Machine Learning: Azure ML, AWS SageMaker, and Databricks for building prediction and optimization models.
- Data Orchestration: PySpark, dbt, Apache Airflow – useful in environments with multiple sources and complex pipelines.
Step 5: Data Visualization, KPIs, and Decision-Making
The final step transforms data into practical decisions and continuous monitoring through operational and managerial dashboards. This is where data visualization tools are used, allowing for KPI (Key Performance Indicator) visualization and a better understanding of the information.
All of this contributes to generating insights, correcting faults, and increasing productivity.
Some examples of KPIs monitored are:
- Operational: OEE (Overall Equipment Effectiveness), cycle time, scrap rate;
- Managerial: Downtime costs, productivity per shift, comparative efficiency between lines;
- Maintenance: MTBF (Mean Time Between Failures), MTTR (Mean Time to Repair), predicted failures, backlog.
These indicators enable industrial managers to act quickly, reducing losses and increasing efficiency based on reliable, real-time data.
Read More: Top 9 Tech Trends for Small Business in 2025
The Role of Machine Learning in Manufacturing Analytics
In this example scenario, we’re using 25+ years of historical production data to develop a predictive model of a manufacturing process. See our previous article. for an overview of how this model is constructed.
In short, we utilize a portion of the historical data to train a machine learning model, and a separate portion of the data to validate the predictive ability of the model. The model is adjusted until we reach an acceptable level of validation.
The source data includes the components needed to manufacture each part, the steps to produce each part, production data including the time in/out at each production station and the QA pass/fail result, the cost and quantity of components (source materials), part order history, and detailed weekly costs including storage, shipping/handling, and other overhead.
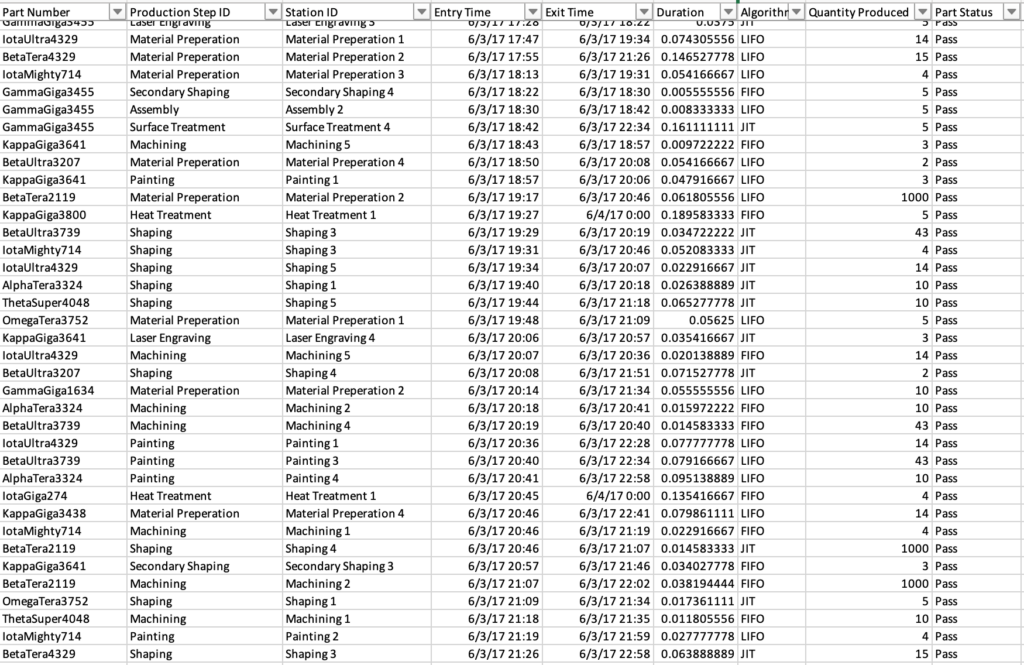
A Snapshot of Production Data
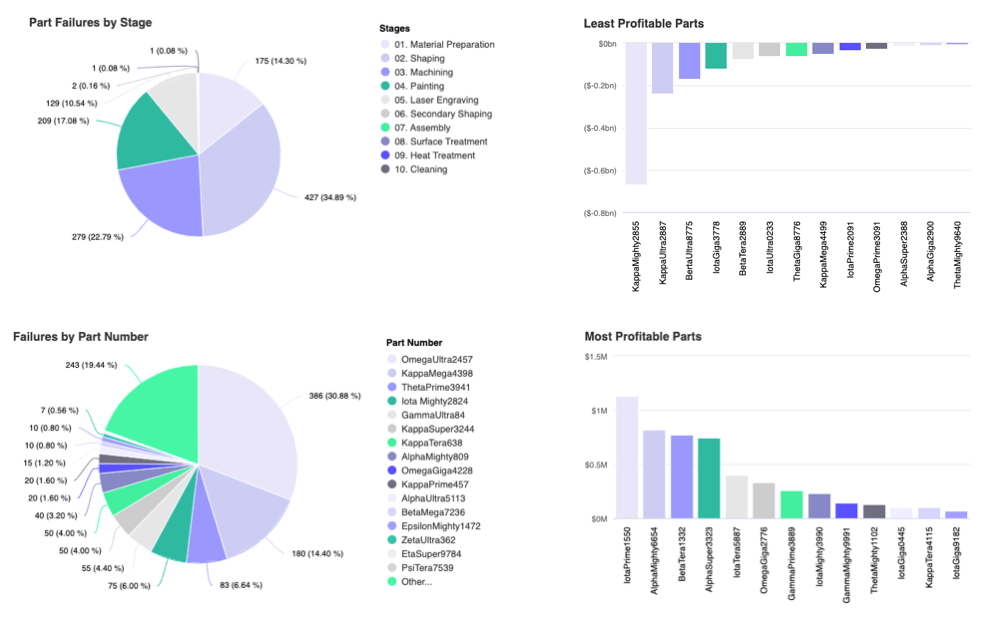
Our primary goals with this analysis are to identify the most and least profitable parts, pinpoint production stages that are the most prone to QA failures, and identify production bottlenecks. Ideally, we’ll also be able to identify which production algorithms (LIFO, FIFO, or JIT) are the most effective and under what conditions, which stations deliver the best and worst QA results, and which parts are the most prone to QA failures.
The interesting thing about this analysis is that these are not static data points; these insights are fluid and change over time. Our ML model allows us to roll the clock forward into the future and make predictions about these key metrics to help identify problem areas BEFORE they happen, giving us the information that we need to make key business decisions.
A Specific Example: Where’s the Bottleneck?
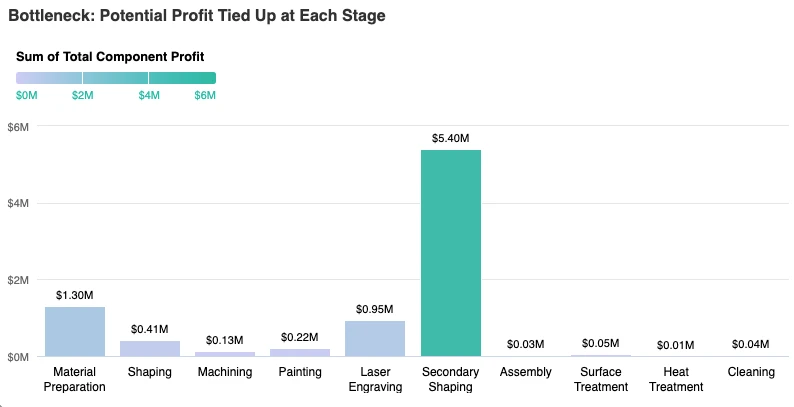
From the dashboard image above, it’s not hard to see the problematic production stage (hint: it’s the big green bar), but let’s dig into this a little deeper! What exactly are we looking at here? In short, we have identified a point in the future where the secondary shaping step is slowing down the production process and we’ve got $5.4M of potential profit held up by this friction.
Our ML algorithm predicted orders which in turn dictated which parts we needed to manufacture, and based on the model we’re predicting this bottleneck will occur. What you do about this insight depends on the nature of your specific business, but you might increase staffing, run extra shifts, outsource, or even invest in more machinery.
For effective decision making, you’ll want to ensure you’re looking at the most up to date information. In this example, we’re using a static data set but in practice, you’ll want to update your source data as soon as it becomes available; if you have real time monitoring in place to continuously update your data set, even better. You’ll want to automate the inclusion of this new data by constructing an appropriate algorithm to properly clean this source data and optimize it for use by the predictive algorithm.
You’ll also want to periodically retrain your model to continuously validate and improve your prediction capabilities. More data is often better, but you’ll want to carefully validate any new changes to your model to ensure you’re headed in the right direction.
Taking it Further
In our simple example here, we’re utilizing only a fraction of the data available to us. There are undoubtedly other factors that contribute to the efficiency and profitability of the business.
For example, how does ongoing staff training affect QA pass rates or machine downtime? Are there specific staff members that might benefit from additional training?
Undoubtably more training would lower failure rates and boost operational efficiency, but training costs money and decreases productivity in the short term. If you’re expanding, and adding new and perhaps inexperienced staff, what are the short and long term expectations?
What about sales and marketing spend? How would increased marketing spend influence orders? How would a re-focus on sales affect our close rate? Could we handle a big surge of orders during our busy season?
If you’ve got the historical data, these types of what if questions can be within reach with a properly constructed and trained machine learning model.
How might machine maintenance schedules be optimized to reduce unexpected downtime? The answer could be found with a properly constructed ML model.
Read More: How to Create a Custom CRM with FileMaker Pro: Step-by-Step
Other Case Uses
Manufacturing analytics goes beyond just improving operations—it offers versatile applications across various aspects of the manufacturing process. Here are some key case uses:
- Predictive maintenance: use machine learning to monitor equipment, predict failures, and schedule maintenance before problems occur, reducing downtime and repair costs.
- Supply chain optimization: analyze big data to streamline logistics, manage inventory effectively, and ensure a smooth flow of materials.
- Demand forecasting: leverage predictive analytics to anticipate customer demand and adjust production schedules, minimizing waste and maximizing efficiency.
- Quality control: enhance manufacturing operations management by identifying defects and ensuring consistent product quality through real-time monitoring.
- Product personalization: utilize data-driven manufacturing to create customized products that meet specific customer preferences and trends.
These applications demonstrate how manufacturing analytics can drive digital transformation and provide actionable insights to remain competitive in a dynamic market.
Read more: Serialized Fields & Table Locking | Codence | Software
Best Practices for Implementing Manufacturing Analytics
To successfully adopt manufacturing analytics, it’s essential to follow strategic best practices. By focusing on clear goals, high-quality data, and the right tools, manufacturers can maximize the impact of their analytics initiatives. Here’s how:
1. Define Clear Objectives
Start by identifying your company’s pain points. Is downtime disrupting production? Are quality control issues leading to inefficiencies? Once you’ve pinpointed these areas, set measurable goals—such as reducing production delays by 15% or improving QA pass rates by 20%. These objectives will guide your analytics implementation.
2. Data Quality and Integration
Analytics is only as effective as the data it uses.
- Data cleansing: ensure your data is accurate and free of inconsistencies.
- Data integration: combine data from different sources, like IoT devices, production systems, and ERP platforms, into a unified system.
- Data security and privacy: protect sensitive data by implementing robust cybersecurity measures to comply with industry regulations and maintain trust.
3. Choose the Right Tools and Technologies
Selecting the right tools and technologies is essential for implementing manufacturing analytics effectively. Claris FileMaker is a standout option due to its flexibility and robust capabilities.
This platform provides scalability, allowing businesses to grow their analytics solutions alongside their operations. Its seamless integration with existing systems ensures that all manufacturing data—from IoT devices to ERP systems—is centralized for easy analysis.
Claris FileMaker also supports customized application development, enabling manufacturers to create tailored solutions that address specific needs, such as real-time monitoring, predictive maintenance, or production scheduling. These features make it a powerful choice for driving data-driven manufacturing.
4. Build a Strong Analytics Team
Assemble a team with expertise in business intelligence, data science, and manufacturing operations. Ensure your team has both technical skills and industry knowledge to interpret data effectively and implement solutions.
5. Start Small and Scale Gradually
Begin with a pilot project targeting a specific pain point, such as reducing machine downtime or optimizing inventory. Test and refine your analytics strategy before scaling it to other areas of the business.
6. Real-Time Monitoring and Actionable Insights
Real-time monitoring is critical for identifying trends, detecting anomalies, and making informed decisions in manufacturing operations. Claris FileMaker excels in this area by enabling professionals to create real-time dashboards that track key performance indicators (KPIs) such as production efficiency, machine performance, and quality control metrics.
With its ability to process and display up-to-date data, Claris FileMaker ensures that manufacturers can respond quickly to issues, optimize processes, and take proactive measures to prevent disruptions. This capability transforms raw data into actionable insights, empowering businesses to enhance manufacturing operations management and maintain a competitive edge.
Read more: FileMaker While Function | Codence | Developers Tips
Get in Touch with Codence
Ready to take your manufacturing analytics to the next level? At Codence, our specialists are here to help you explore the full potential of Claris FileMaker and how it can transform your operations. Whether you’re looking to optimize processes, enhance real-time monitoring, or implement custom solutions, our experts have the knowledge and experience to guide you.
Contact us today to learn more and start your journey toward smarter, data-driven manufacturing.
Read more
Subscribe to get the latest in your inbox.

Built with you in mind
Speak to one of our expert consultants about making sense of your data today. During
this free consultation, we'll address your questions, learn more about your business, and
make some immediate recommendations.